Kanban board, Gant chart, User-Story map, time-tracker, calendar, reports.
We talk about tools that will help organize work on the project.
1. Kanban board
2. Gant chart
3. Calendar
4. User-Story map
5. Time-tracking
6. Reports, reports and more reports
There is an expression: only a fool needs order - genius rules over chaos. For a freelance artist, this statement may be true, but for a team that is developing a new product (even a very creative and innovative one), this approach can negatively affect the business process. Therefore, the working group must have project management tools in its arsenal.
According to Standish Group, the share of successful IT projects in 2020 averaged 31%.Consequently, the remaining 69% were unsuccessful or failed. And here are somemore statistics on startups. The 2022 Startup Genome Report found that about 90% of all startups fail. The reasons are different, but some of the main one sare:
Ineffective project-management. Because of this, the team creates a low-quality product,does not have time to prepare it on time, or it turns out to be completely irrelevant for consumers. Problems of this kind appear in the absence of communication between performers and the customer, the manager and employees,as well as team members among themselves. Also, the product turns out to be unclaimed when there is not enough feedback from the client and a good analysis of his needs.
Therefore,the success of a new product largely depends on proper management and analysis of the working situation. There are methods and tools that help companies around the world develop.
Methodsare a philosophy, an approach to management. We have already reviewed them in detail in our blog: 10 well-known project-management methods.
Project manager tools are special programs that help you plan, organize and control the execution of a project. They streamline team communication, make it easier for managers to monitor task progress, manage project resources and budgets, and communicate with stakeholders.
We will tell you about the main tools for:
- work flow visualization
- user journey research
- working time planning
- analysis of team work
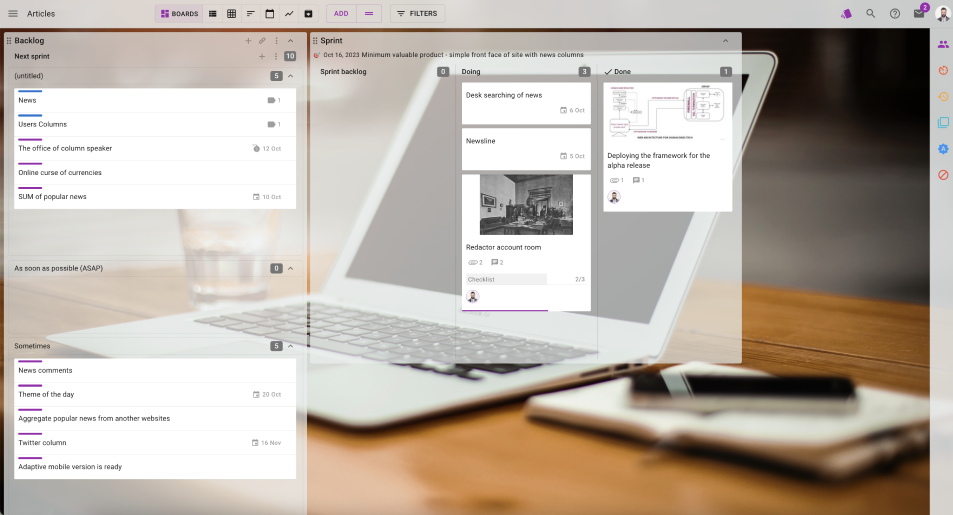
The first tool for operational project-management is the Kanban board. It helps streamline daily work and organize a flexible approach to project planning. It is a space where all project tasks and their current status are visually displayed. You can create a Kanban board on any offline board and place it in your office. It can also be done using digital tools.
Advantages of the online format:
- you can organize the work of remote employees
- more possibilities for visualization, unlike an offline board
The key components of a Kanban board are columns. These are vertical areas on the board that reflect the stages of work or the status of the cards.
The board can have simple stages: “In Queue,” “Working,” and “Done.” That is, each employee selects a task from the “In Queue” column. Then moves it to the “In Progress” column. This is how the employee notifies everyone about his employment. Once the work is done, the card needs to be moved to “Done”. And so with every task. You can add an unlimited number of columns to your board and give them any names to display your work flow in more detail.

All tasks move through designated stages and signal to team members about the progress of work on the project and the employment of specific employees. One card usually corresponds to one work task.
FlowFast cards can be configured with different visual cues to help describe tasks in even more detail:
- marks from those responsible for the work,
- deadlines,
- important files for completing technical specifications,
- card sizes (if the team uses Scrum), checklists for monitoring progress and other fields that you yourself want to add.

All these metrics are briefly displayed on the main board. That is, by looking at the card, any team member is able to assess the degree of readiness of the task, whether the person responsible is able to complete it on time, and whether help is needed.

A special feature of the Kanban board in FlowFast is the presence of paths. These are horizontal areas on the board that help divide tasks by priority, class, or assignee.
For example, in the image below you can see how using tracks it is possible to separate tasks into urgent and routine ones.

In general, the Kanban board helps to quickly notice bottlenecks - when many cards accumulate at one stage.
👉Work flow bottleneck: how to understand where projects are stuck
Remember to hold retrospective meetings and explore work flow issues. Constant analysis will help you complete the project on time or even earlier.
A Kanban board can be adapted for almost any project. They are used to manage project portfolios, to develop IT products, in marketing and even in HR departments.
This is another tool for visualizing any project. A Gant chart is a project roadmap.It usually consists of two parts: on the left is a list of assigned tasks, and on the right is a timeline with bars that depict:
- dates of start and completion of work on stages,
- mile stones(major stages) that the project must pass,
- tasks that must be completed within each stage,
- connections between tasks.

The Gant Chart in FlowFast calculates the number of working hours that will be needed to complete each task and forecasts the workload, which is especially important for project management.
Kanban board and Gant chart can be used together. The first will help organize the work of performers and monitor the implementation of each specific task, and the Gant chart will be useful for planning the project and monitoring its implementation as a whole.
Calendar is one of the FlowFast workspace display modes.
In cards in the regular space,if you set a due date, used a custom Date field, or set a Timeline, those tasks will appear on the calendar grid.

What teams and tasks is Calendar suitable for?
For work groups where it is especially important to keep track of the dates for fulfilling their obligations:
- SMM managers and content makers who must post content in accordance with the mediaplan;
- accountants who are required to send money to full-time employees and freelancers on aspecific day;
- marketers who need to release promotional offers on the website on a specific date;
- developers who have release dates;
- event industry workers who are responsible for conducting online and offline events;
Cards vary in color. The color depends on the type of task. The table will also show the stage of work. Urgent tasks are marked with a light 🔥.
Before we move on to the concept of User-Story map, it is necessary to tell what a User-Story is - this is a short and understandable description of the functions of a product or its features that the user will receive as the final value.
To create a User-Story you need to answer 3 questions:
1) Which user is the product being developed suitable for?
2) What does he need from the product?
3) How will the user get what he wants?
The answers to all these questions need to be formulated in one sentence.
Example: I am a buyer of an online bookstore and want to receive selections of new books that are interesting to me in the messenger so as not to miss new items.
Forming a user story allows you to look at the project through the eyes of the consumer, and not focus only on functions. This approach will help create a sought-after product.
User-Story map is a tool for holistic product design based on the user journey. That is, you formulate a user-story and, based on it, build a detailed task plan(User-Story map), after completing which you will create a product that isrelevant to the consumer.
How to create a User-Story map?
1. Preparatory stage. Determine a team to work on the map and prepare a visualization tool. To visualize the User-Story map in FlowFast there is an additional module. The user story map can be worked on by the product owner or the development team. If necessary, marketers, UX/UI designers, and analystsare involved.
2. Brainstorming. Work with your team to answer questions such as:
- How exactly does the customer use the product?
- What product characteristics are especially important to the consumer?
- What features do competitors not have?
3. Definition of user actions and formulation of main stages. Determine what steps the customer takes when working with the product. This will help you identify major work steps, set high-level tasks, and plan releases. Reflect all major tasks on the User-Story map in FlowFast.
4. Setting priorities.Prioritize within each stage. Identify what tasks need to be done first, and what functions can be done after the product launch as part of improvements and additional budget.
5.Finalization of the project map. Now that the map is created and tasks are prioritized, associate user stories with cards on the boards.
At the end, make sure that all steps correspond to the project goals and tasks are planned correctly. Based on the map, you can create a backlog.
With the rise of remote work, programs for time management and tracking employee time have become increasingly popular.
They help to distribute the work load in a balanced manner, and in the case of freelance employees, calculate the cost of work.
For time-tracking, FlowFast has a Time-Tracking module. It is designed to control and distribute working time, and also helps plan project deadlines. Each employee starts the timer independently, recording the beginning and end of work on a task. As a result, the manager will be able to calculate the cost of work based on the recorded time.


You can view time spent records in the card itself, or, if you have access to the administrative section, use the full Time-Tracking report. If necessary, the data can be downloaded in Excel format.
Analytics occupies a special place in project-management. The purpose of each report is to highlight problems in the work process and suggest how to solve them in order to increase work efficiency, as well as predict the timing of future tasks. Data from reports can be presented at retrospectives in order to optimize processes together with all team members.
We have already talked about the time spent report. But that's not all there is to FlowFast. Below you can see a short list of reports and an overview of their capabilities. You can always read more about how to use them in our Knowledge Base in the “Reports and Graphs” section.
This is a basic report in FlowFast. It automatically records the tasks of each employee and the time spent working on them. Anyone can go into the report and analyze which employees were the most productive and who took on the biggest tasks. The project time spent report can be downloaded in Excel format.
Summary report on tasks

Acumulative flow diagram
Acumulative flow diagram shows the distribution of tasks across process steps over time.
On the one hand, on the graph you can find standard information for the project - how much work has been completed, how many tasks are left, the pace of the project. On the other hand, you can get a lot of information about problems in work flows. This is where the real benefit of a graph lies.
In our blog,we have already discussed in detail all the team problems that can be seen on the cumulative flow diagram.
👉 13 cases for working with a cumulative flow diagram
Task-Burndown Chart
This report is intended for teams that work in Scrum. The diagram shows how many cards the team has left to complete, and whether it will have time to complete it before the end of the sprint. If you use Story points, the graph will take into account not only the number of tasks, but also their complexity.

Tamspeed by sprints and speed by participants
These two reports are also intended for teams that work with the Scrum board.
Team velocity is the amount of work a Scrum team can complete in one sprint. The system calculates data at the end of the sprint based on the specified Story points. Based on these indicators, the manager can plan a future sprint and evaluate the result of innovations in the work process.

Need by team members - shows the contribution of each employee to work on sprint tasks. Looking at the graph, you can compare the change in the workload of workers in different sprints. The report will tell you which employees are overworked and highlight particularly active people who can be given a bonus to motivate further hard work.
A control chart shows the completion time of tasks over a certain period. The graph shows how much time was spent completing each task. The higher the point on the graph, the more days it took to complete it. If you have over a dot,the name of the task and how long it took to complete it will appear. This chart will help you identify deviations in your workflow, determine which tasksare wasting too much time (for example, due to blockages), and address them.

Through put is the amount of work completed in a certain period. For example, a team completes 15 tasks per month. You can create a schedule not by the number of tasks, but by their size (Story points). The schedule only takes into account completed work. Tasks that have not yet been completed are not taken into account.
A schedule helps predict how much work a team can accomplish in a specific time.This data is necessary when calculating the project release dates.
Using this report, you can monitor compliance with task deadlines. If the completion time is overdue, it is easy to find out who is responsible for these tasks and already drill down into the reasons for the delay.
This metric tells you how long a task was in progress from the moment it was taken on until the moment it entered the “Done” stage. Cycle times need to be known to plan future projects. The schedule will help you analyze the timing of task sand understand which stages of work take the most time.
You can also track at what stage tasks get stuck. Thanks to this, it will be clear what is worth optimizing.
Dinamics of cycle time changes

The manager must not only note the cycle time and take it into account when planning new projects, but also optimize the work so that the cycle decreases. To track dynamics there is a report Dynamics of changes in cycle time. Therefore, it can be used to track how cycle times are changing and understand whether the team’sspeed has been increased.
In many reports we have talked about tasks and steps that take too much time. If a task took a long time to complete, most likely, employees encountered blockages in the process of completing it. Work can be blocked by life events, for example,the illness of a highly specialized employee, or errors in organizing the work process, for example, incorrect technical specifications. A lock resolution timeline helps you analyze the nature of locks and how quickly problems are resolved. The data will help you take these points into account in a new project or it eration.

resolution time
There are many modern project-management tools, as well as methods. The task of an experienced manager is to select those that are suitable for a specific project and a specific team.
Kanban board is the most universal solution, since the settings of this space are very flexible. However, the new team will need time to create the perfect columns,labels and checklists.
The Gant chart and User-Story map are especially useful when planning a project.Further, they work more as a control tool, a tool for managing project deadlines.
The advantage of any online task tracker is the ability to analyze work. All kinds of reports will help the manager to be aware of any deviations in the work process. It is not necessary to use all reports. For example, you may only need data about through put and blocking.