
For teams using Scrum, FlowFast offers all the necessary functions:
• scrum boards,
• problem assessment and poker planning,
• burndown chart, report,
• command velocity (velocity), report,
• support for Scrum of Scrums, LeSS and other frameworks for a large number of Scrum teams.
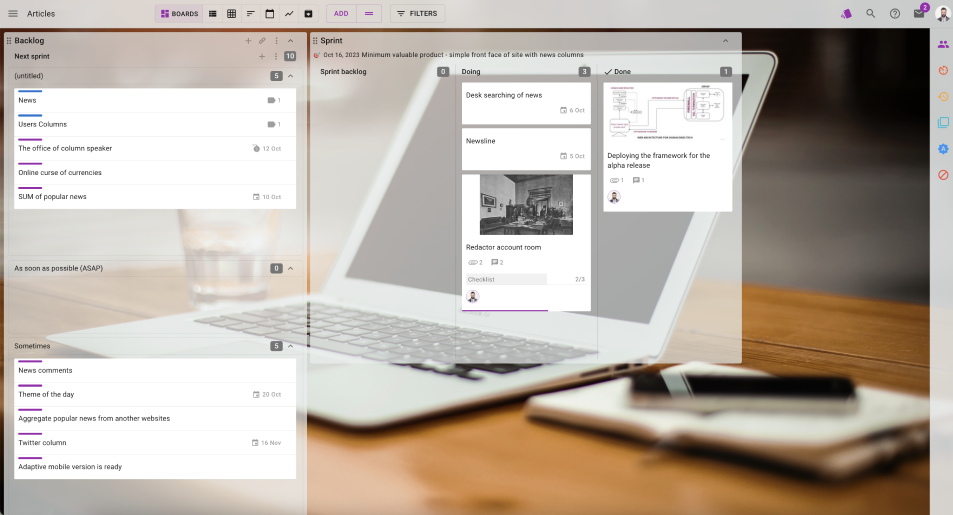
FlowFast has a ready-made template for working on Scrum. It consists of a Backlog and a Sprint
board.
The Backlog board stores a queue of tasks for the product.
The Sprint board has three columns:
1) Sprint Backlog
2) In Progress
3) Done.
If necessary, you can add additional columns and lines.
Click on the purple button in the upper right corner of the FlowFast. Then click “Create a new
board.”
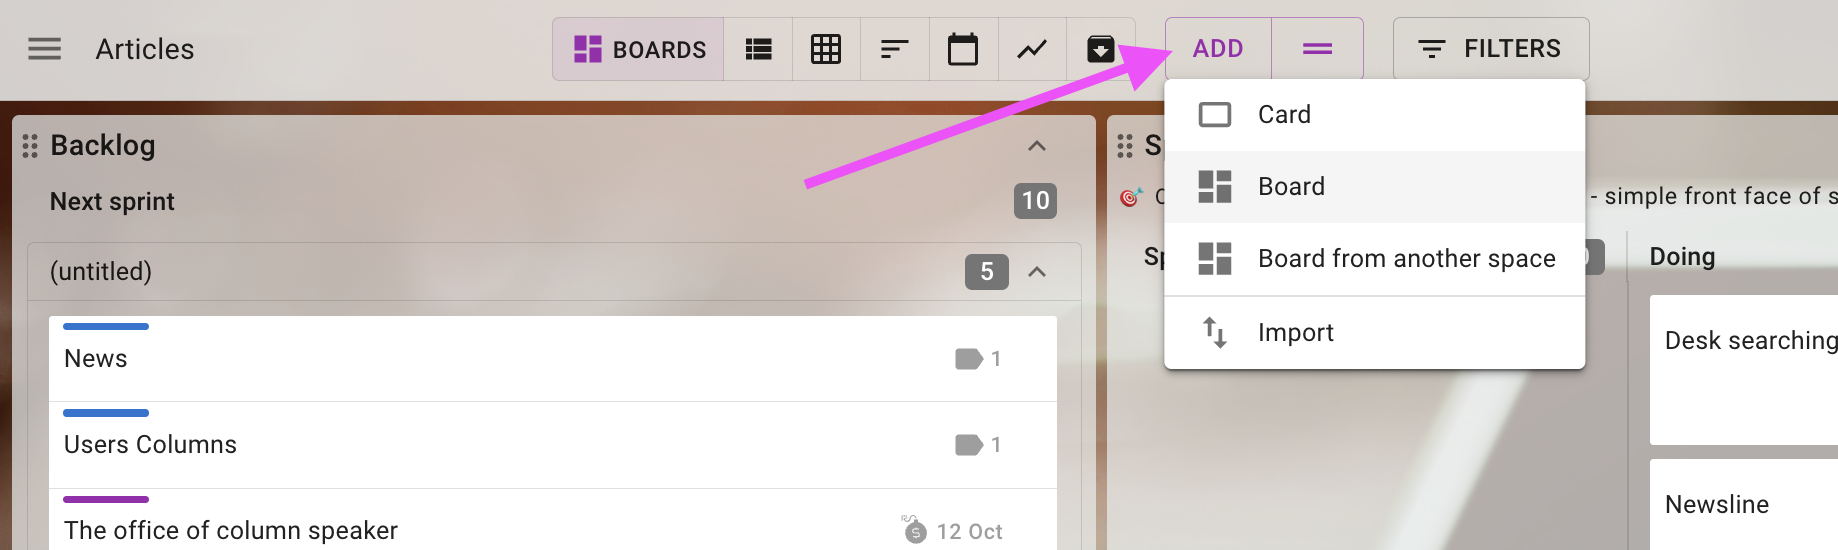
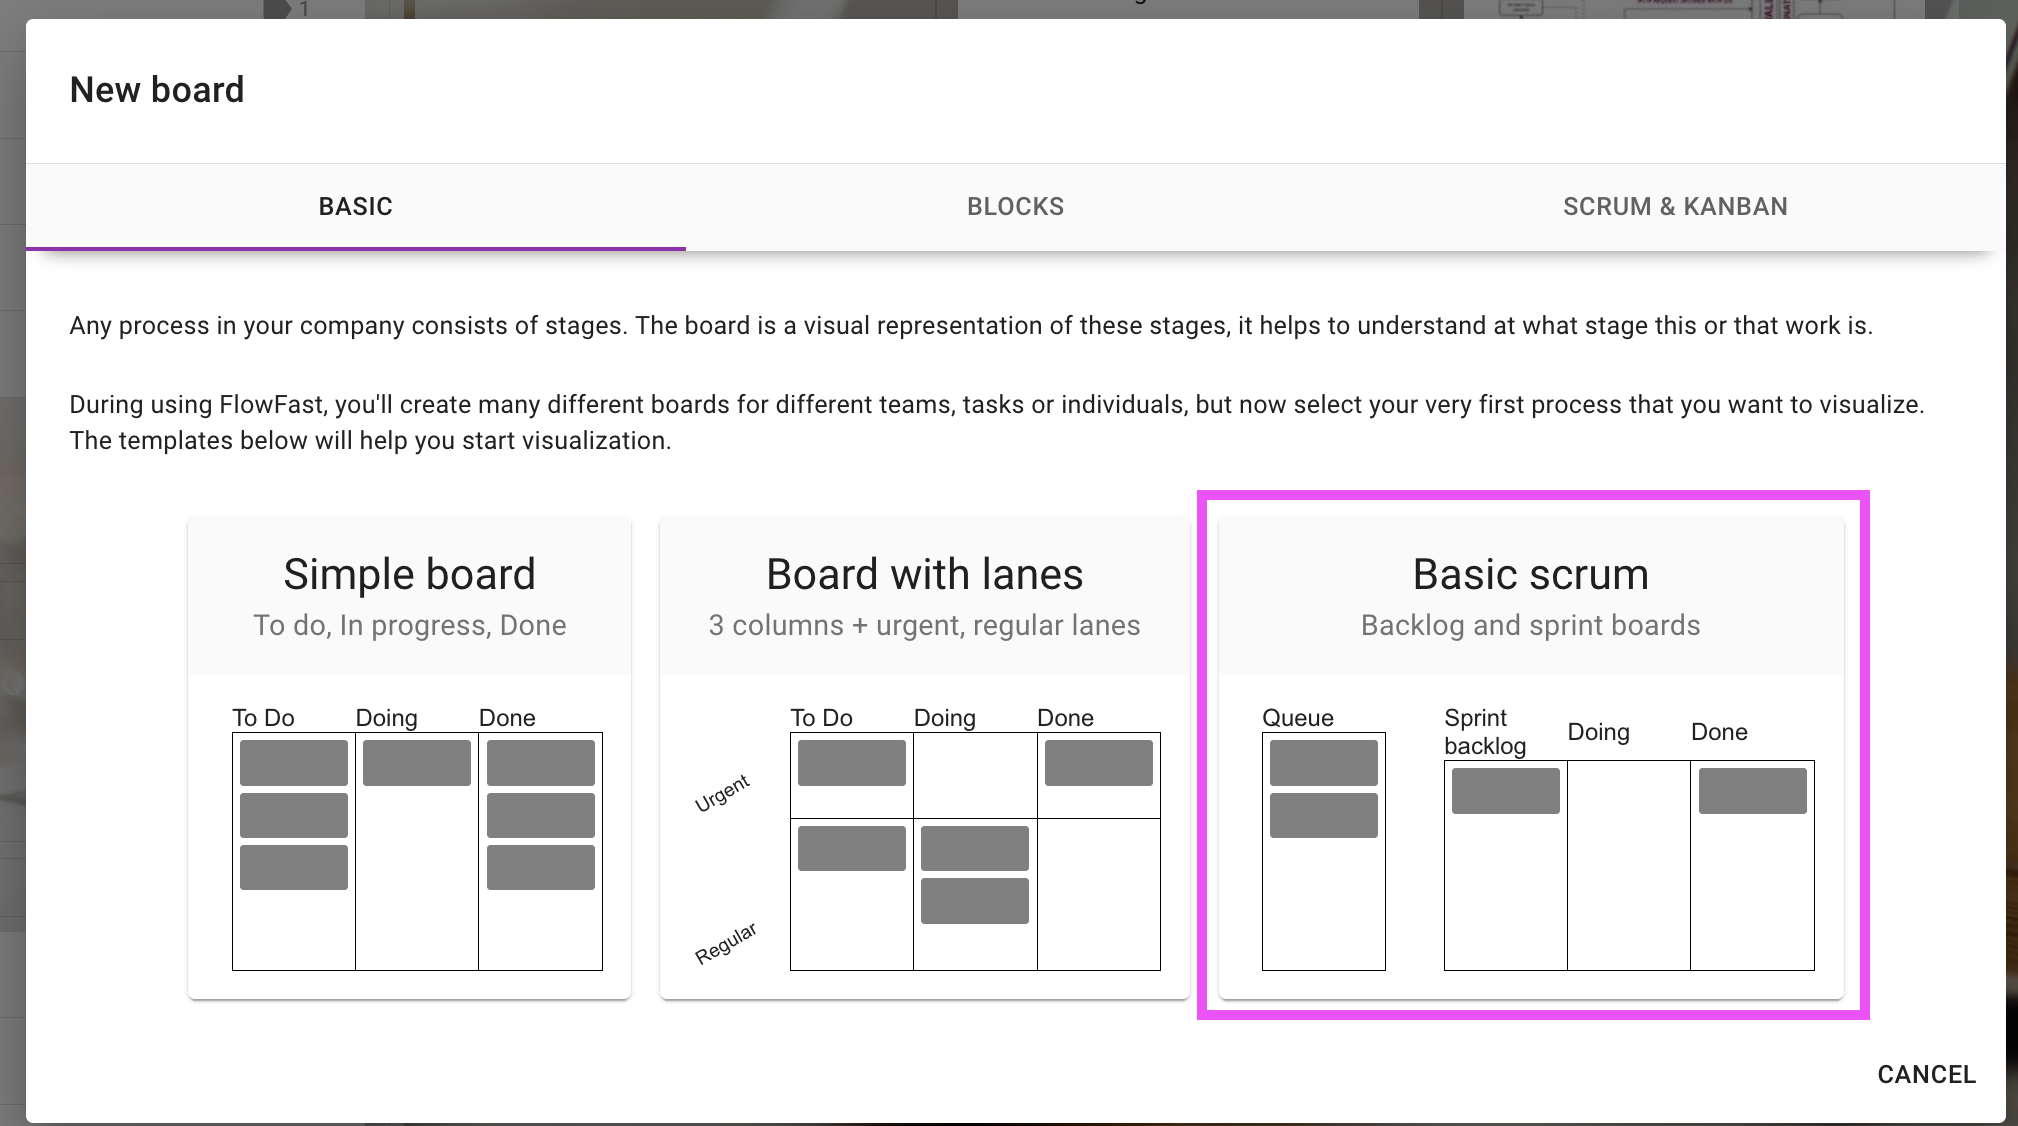
In the window that appears, select the “Scrum” template
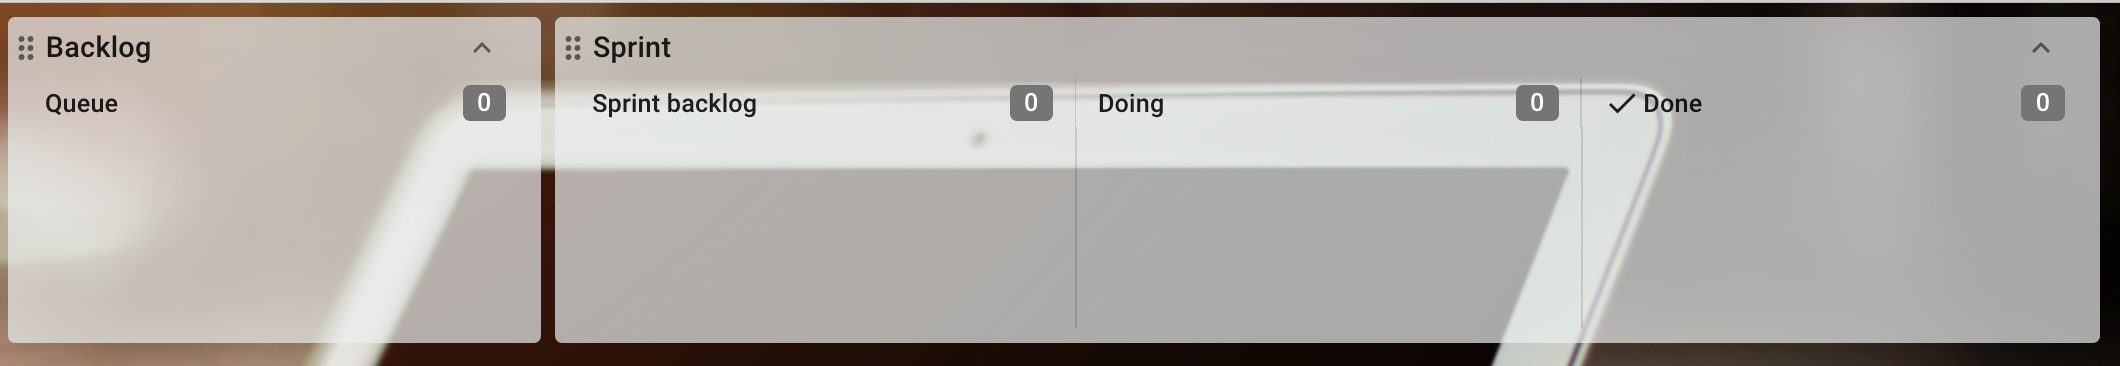
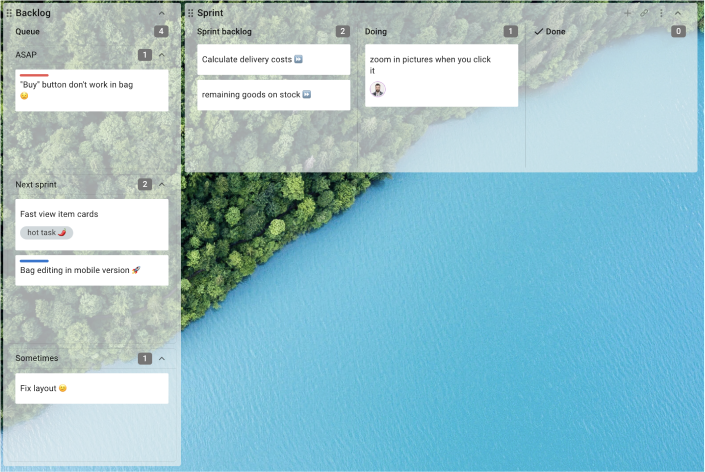
This is what the newly created board will look like.
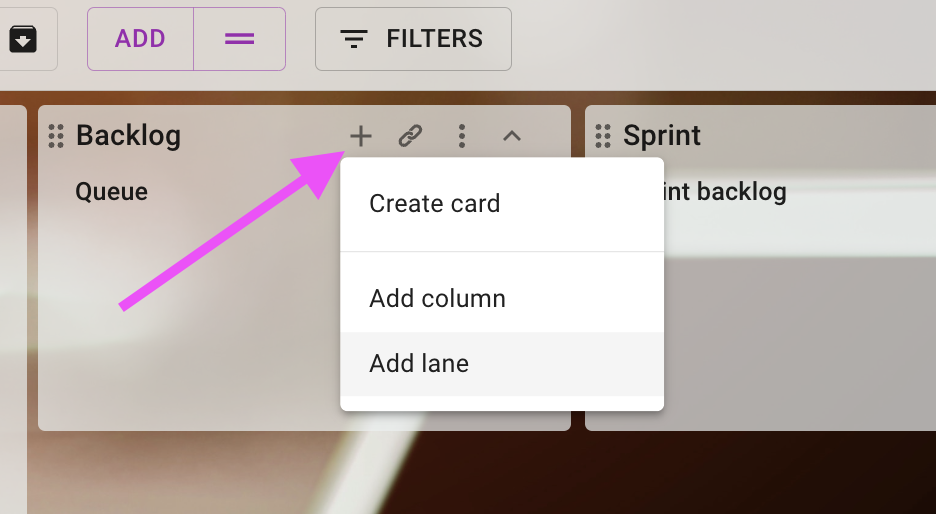
You can create additional tracks and columns on boards in FlowFast.
This will help, for example, organize the backlog.
To add a track, you need to click on the + next to the board name and select “Add lane”.
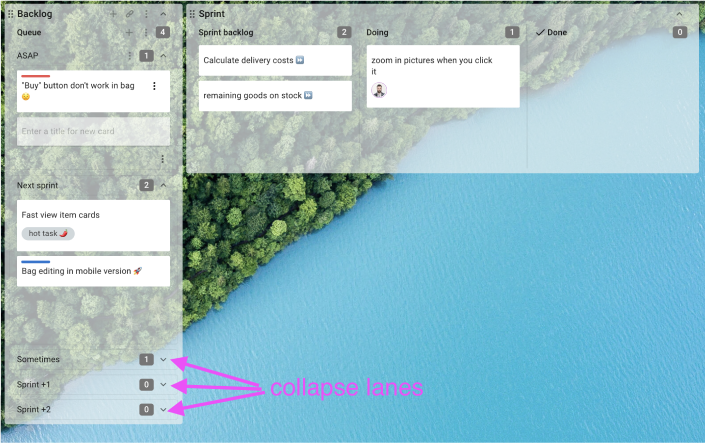
We create three tracks in the backlog: urgently, next sprint and someday.
You can create an unlimited number of tracks on the board, for example, to plan work several
sprints ahead.
So that the track does not take up much space on the board, it can be rolled up.
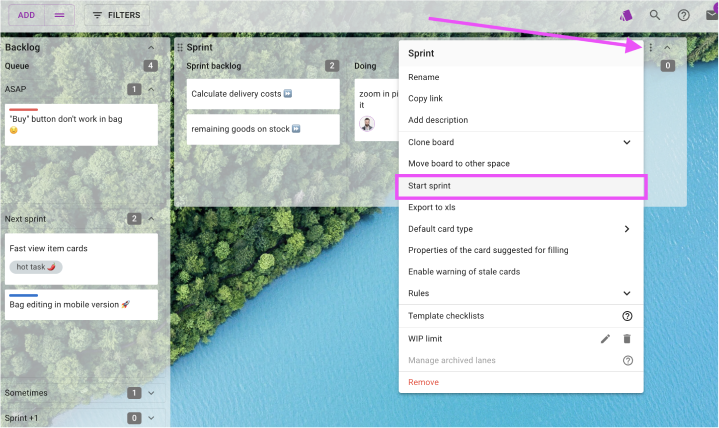
Scrum boards in FlowFast have a sprint launch feature. When launched, a mark on the sprint
dates will appear on the board, and sprint analytics will become available to you: a burndown
chart and team speed.
To start a sprint, click on the three dots in the upper right corner of the Sprint board. From the
board drop-down menu, click “Start Sprint”.
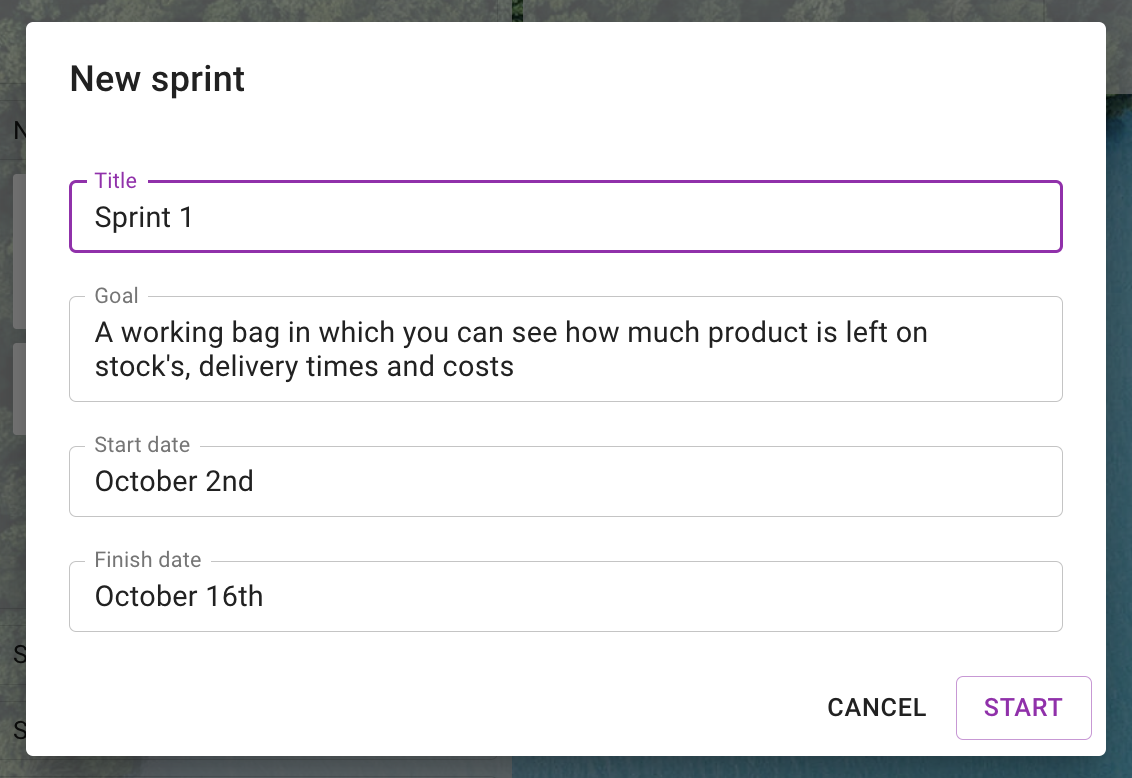
Next in the form you need to fill in the name, start and end date of the sprint. Optionally, you can
set its purpose.
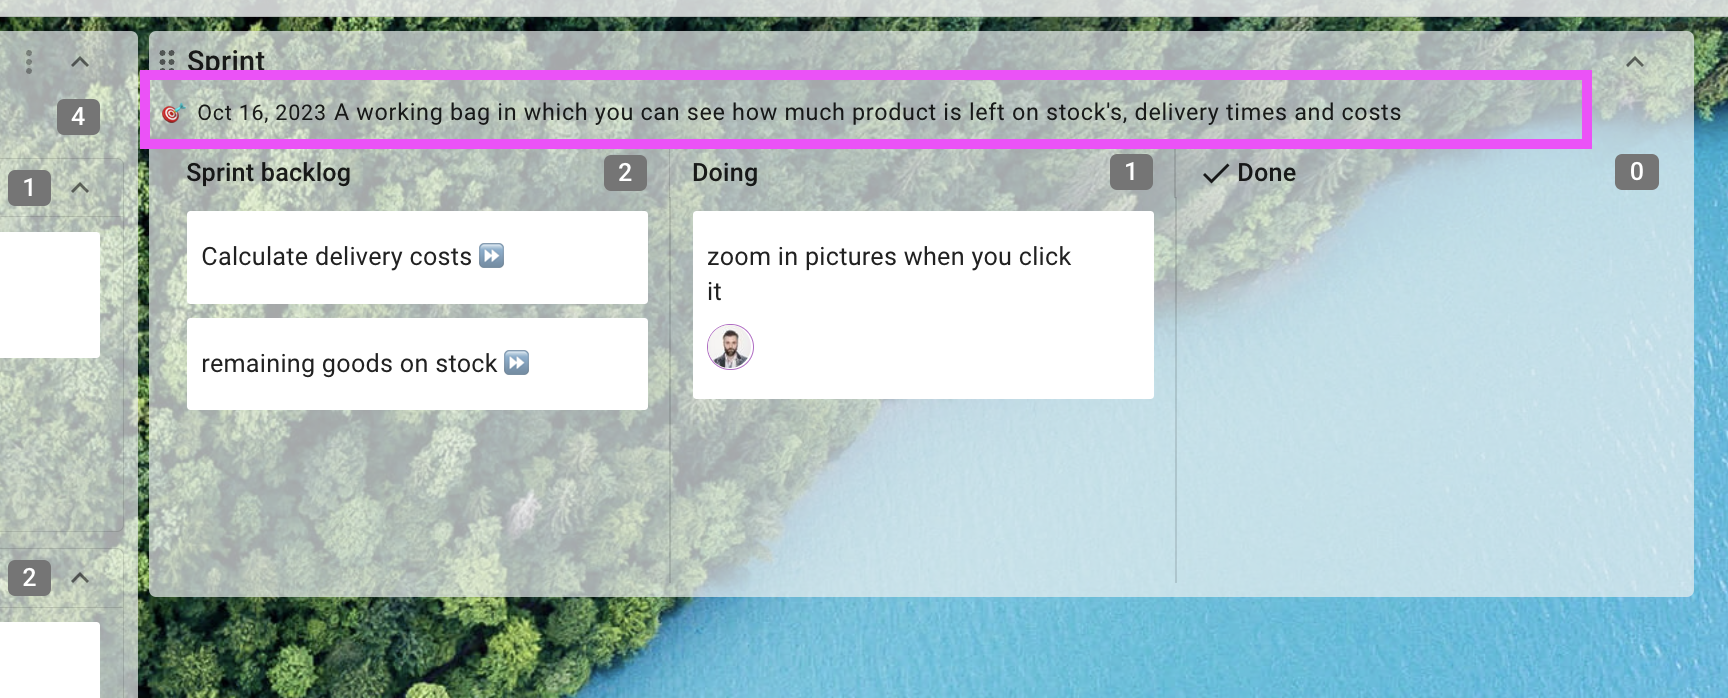
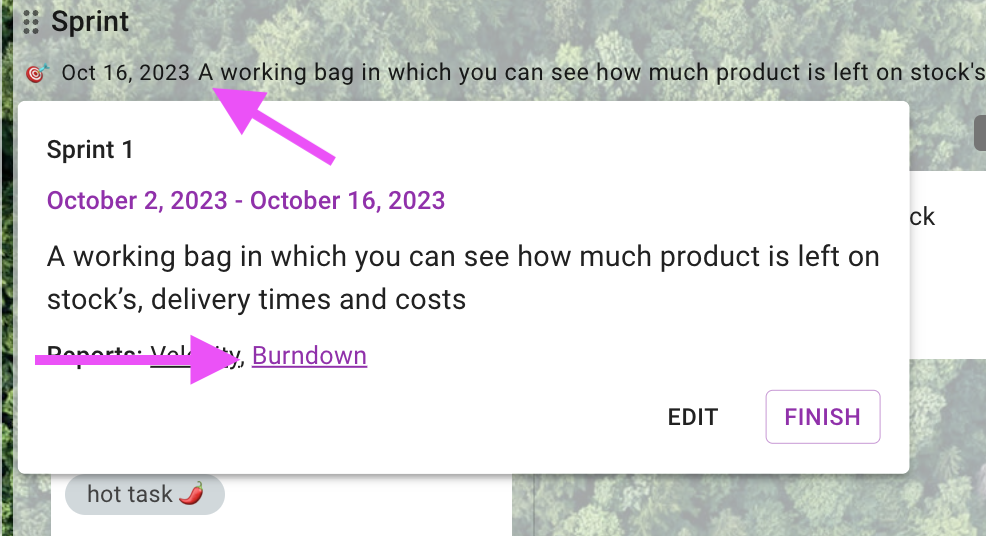
After the launch, a mark will appear on the board indicating that the sprint has started. By clicking
on this mark, the team can view the combustion graph in real time.
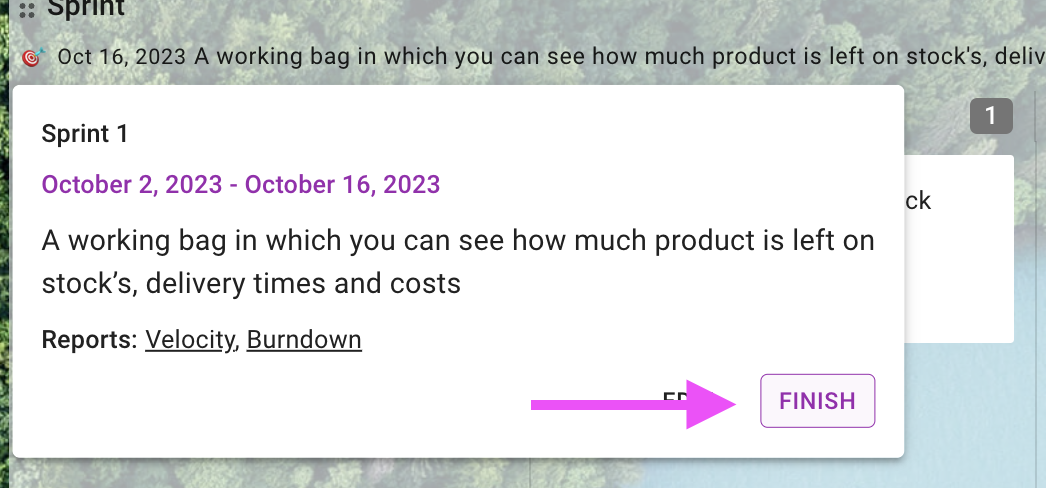
When the sprint is completed and the status of the cards is updated (they are in the columns
corresponding to their status), click on the name of the sprint and “Complete” in the window that
appears
After the sprint is completed, all cards in the “Done” column will be archived. Unfinished tasks will
remain on the sprint board.
To start a new sprint, drag cards from the Backlog board to the Sprint board in the Sprint Backlog
column. If there are unfinished items on the board from the last sprint, also move them to the
“Sprint Backlog” column and start a new sprint.
Simple rating in Story Points
For simple rating options, such as Story Points, you can use the Size field.
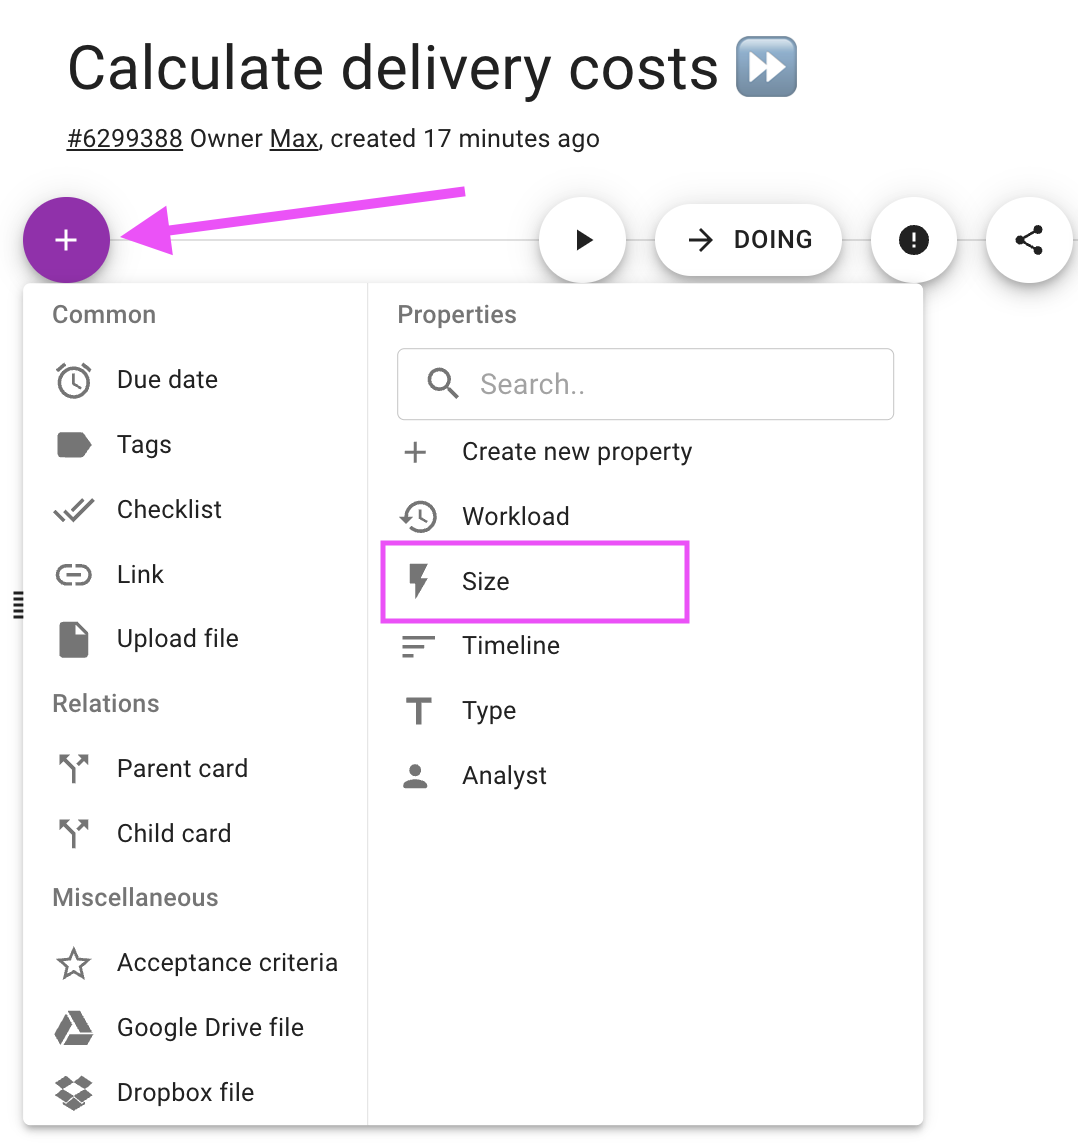
Open the card, click on the purple button in the upper left corner. Select the "Size" field.
After this, the “Size” field will appear on the card. Click on “Set size” and enter the estimated size
of the task in any units.
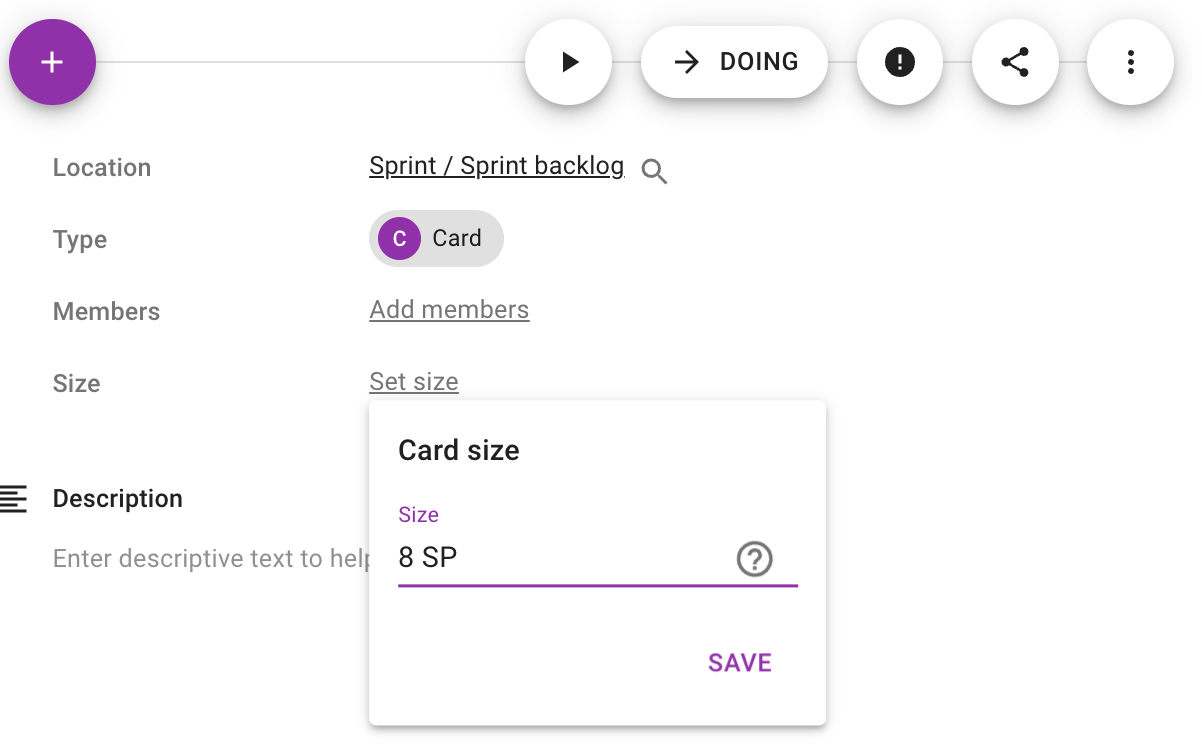
The task size will be visible on the card front in the lower left corner.
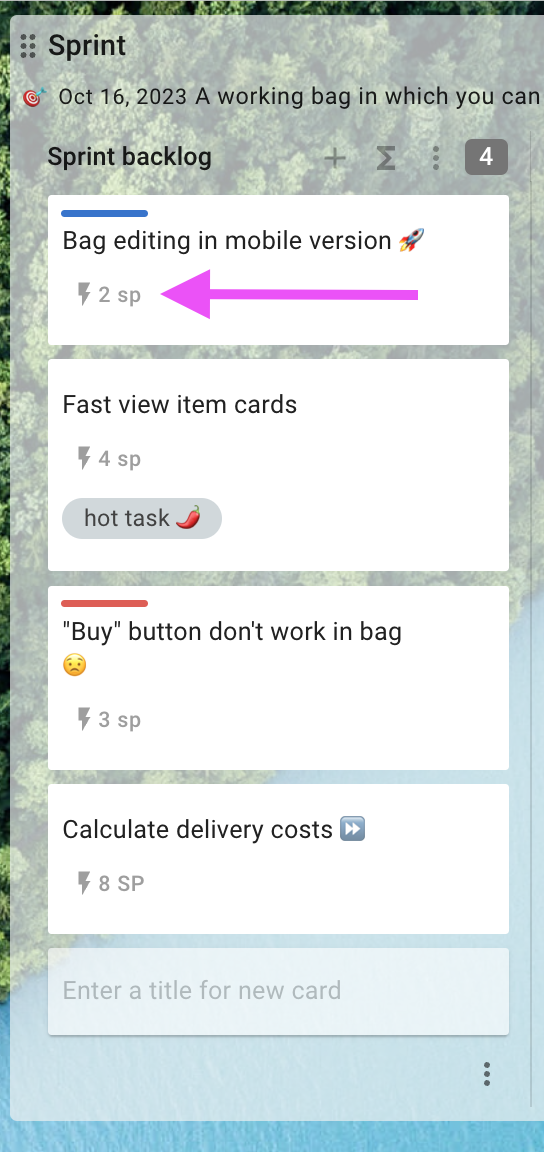
Each card in the sprint backlog shows its size
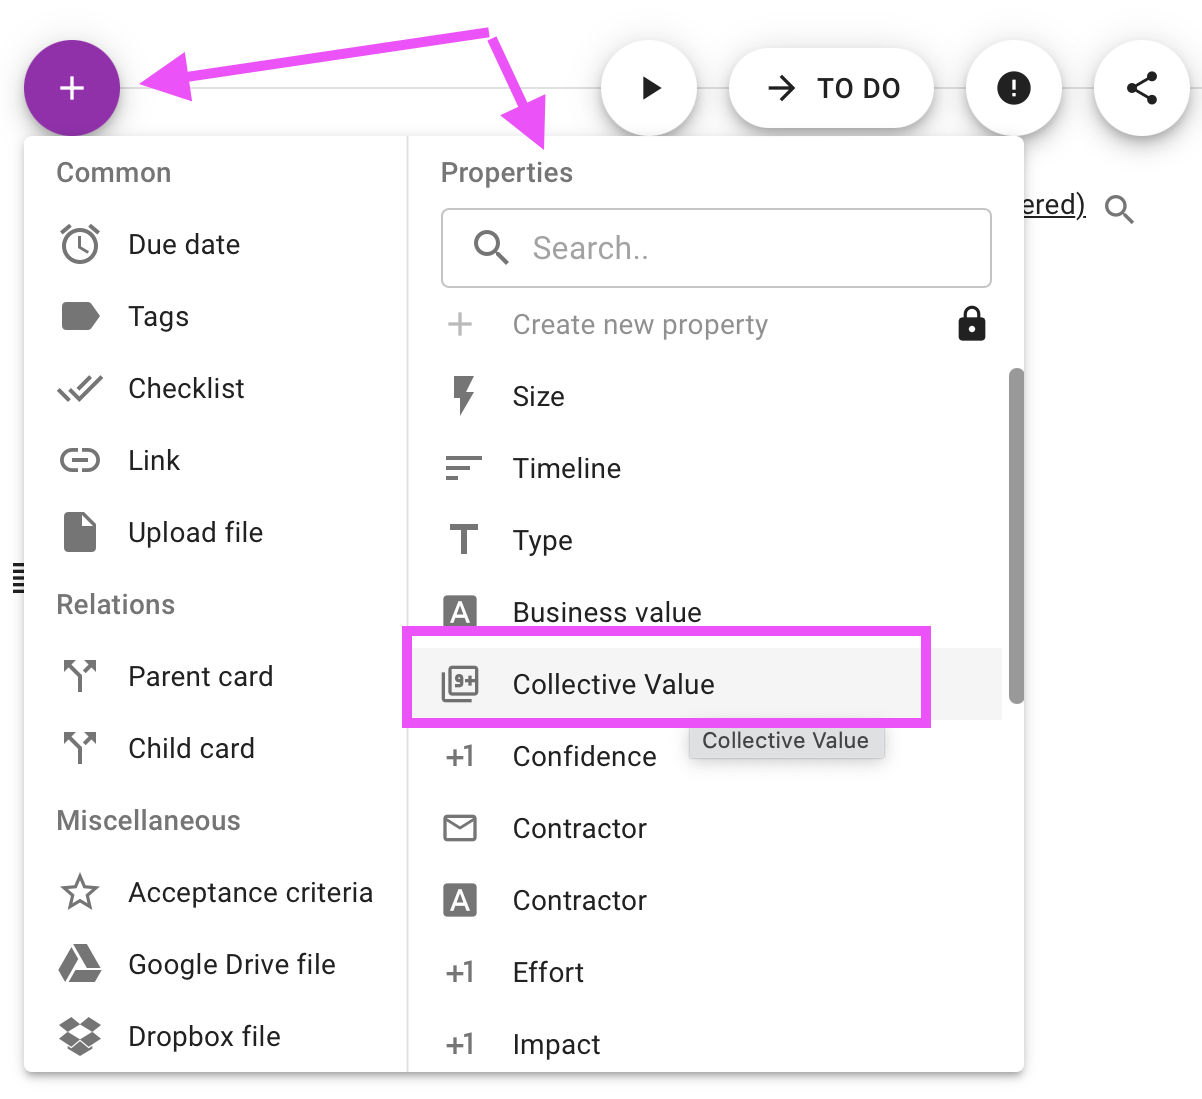
For poker planning, you can use the “Collective Assessment” field, which allows you to conduct
poker planning meetings in hidden assessment mode.
A burndown graph shows how much work has already been done and how much remains to be
done. The team can view their combustion graph at any time.
How to view a sprint burndown chart
This is what the burndown chart looks like for a completed sprint.
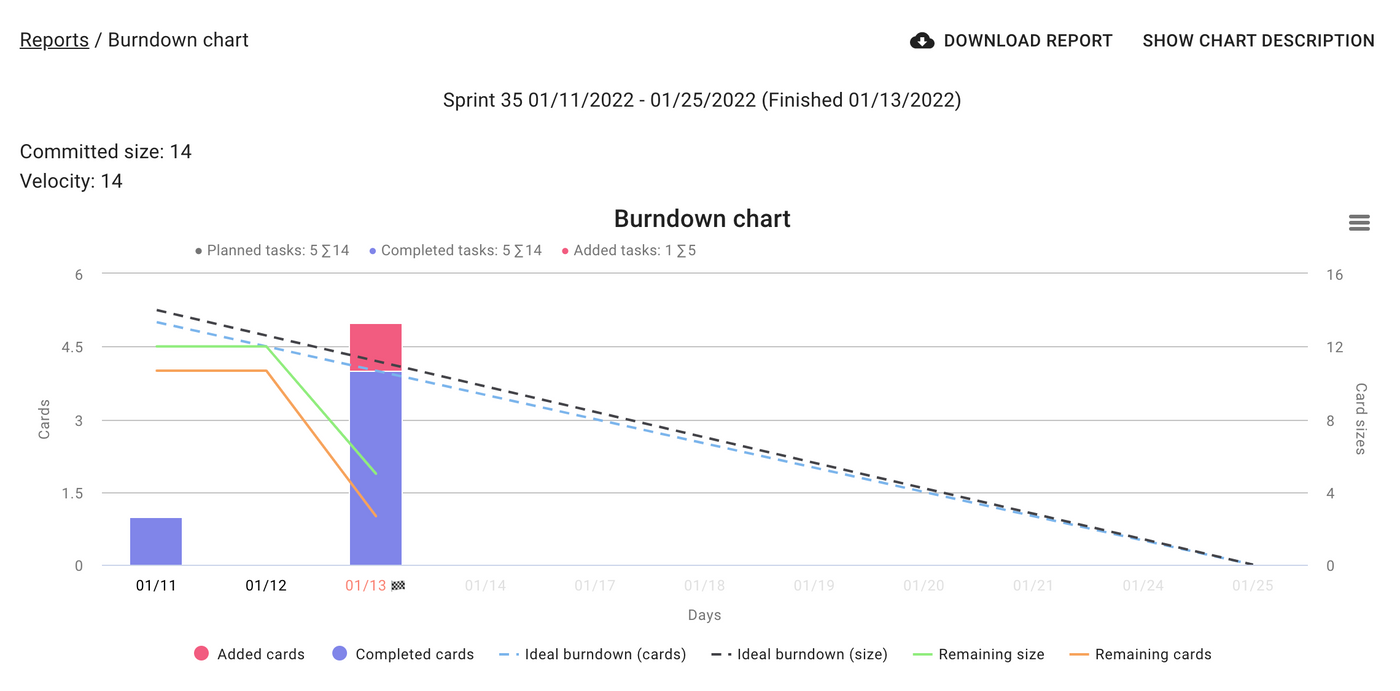
The burndown chart displays information about added and removed tasks from the sprint.
Below the burndown chart, the report contains information about the status of the task at the end
of the sprint.
All graphs and reports are saved in the “Reports” section, i.e. At the retrospective, you will be able
to view a report from any past sprint.
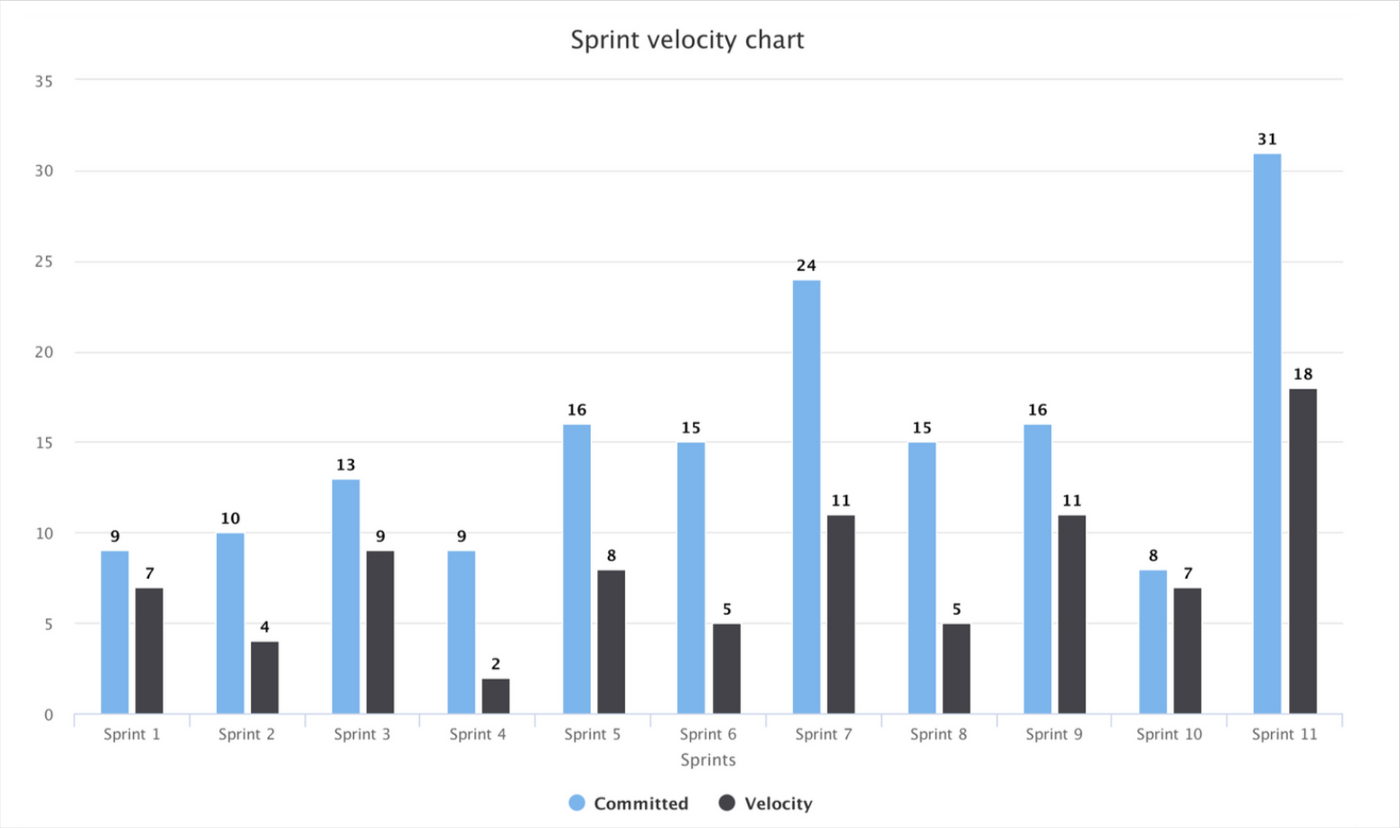
The left column in the graph shows the assessment of tasks taken into the sprint (the sum of the
assessments of cards in the columns of the “Queue” and “In Work” types at the time the “Start
Sprint” button was clicked).
The right column displays the sum of the grades of completed cards (those in the "Done" column)
at the end of the sprint.
This graph shows the contribution of each participant to completing tasks during the sprint.
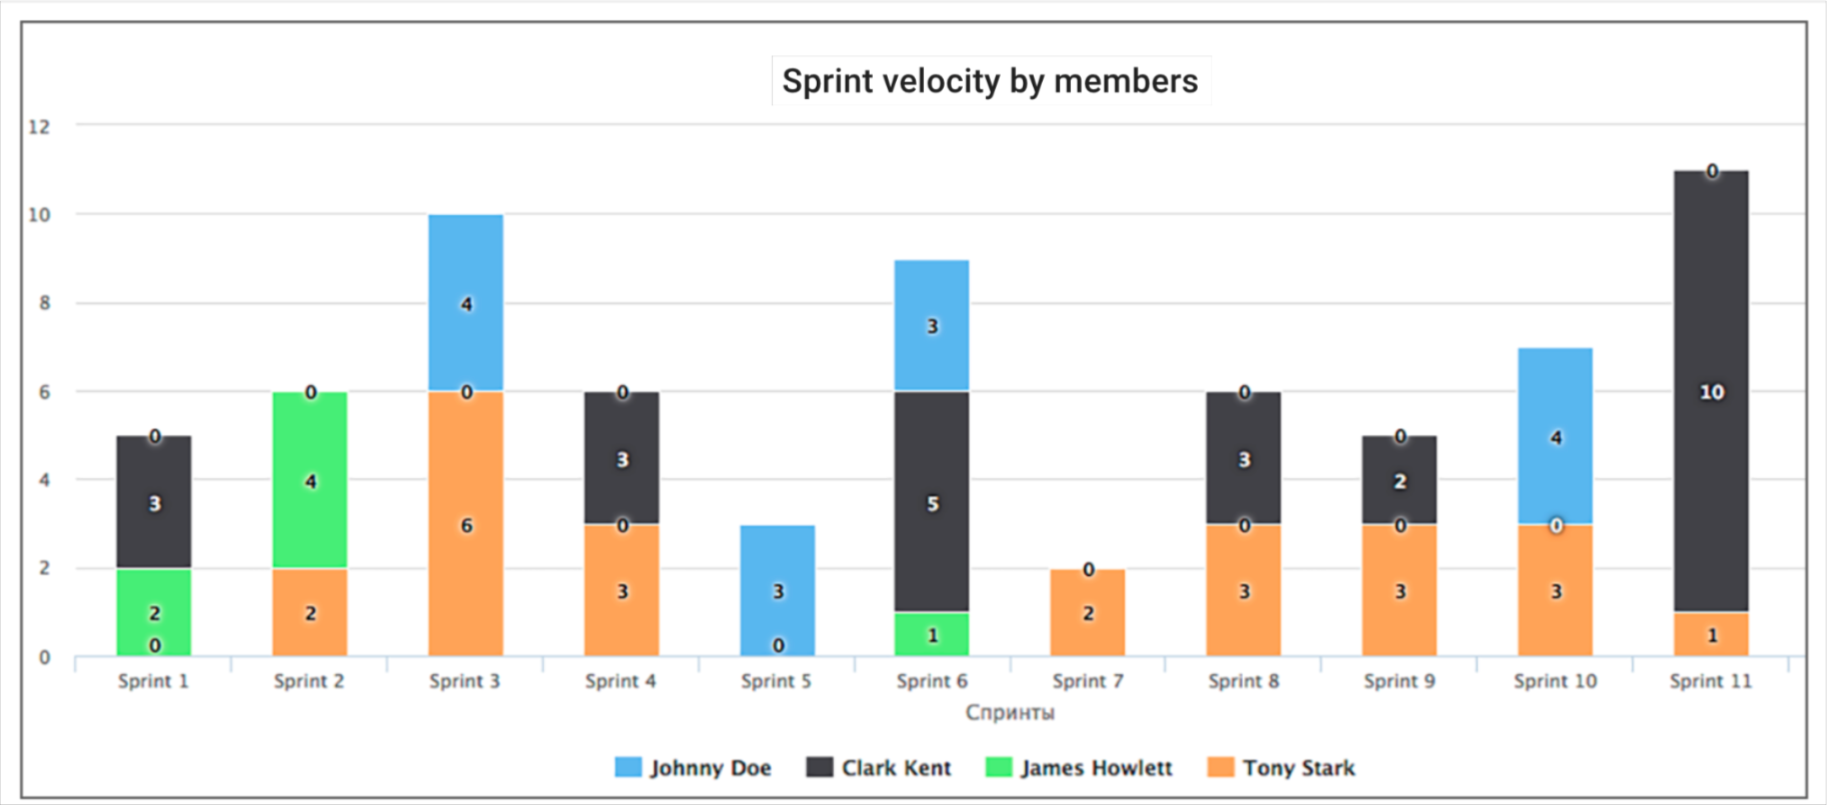
The values are calculated as follows: for each card completed in the sprint, its size is divided by
the number of participants, then these numbers are summed for each participant.
As Scrum scales, the number of Scrum Teams increases and it becomes increasingly difficult to
synchronize their work. FlowFast solves this problem by using two-tier boards. You can create a
top-level Scrum board with large tasks and team boards on which child tasks in relation to the
sprint tasks will live.
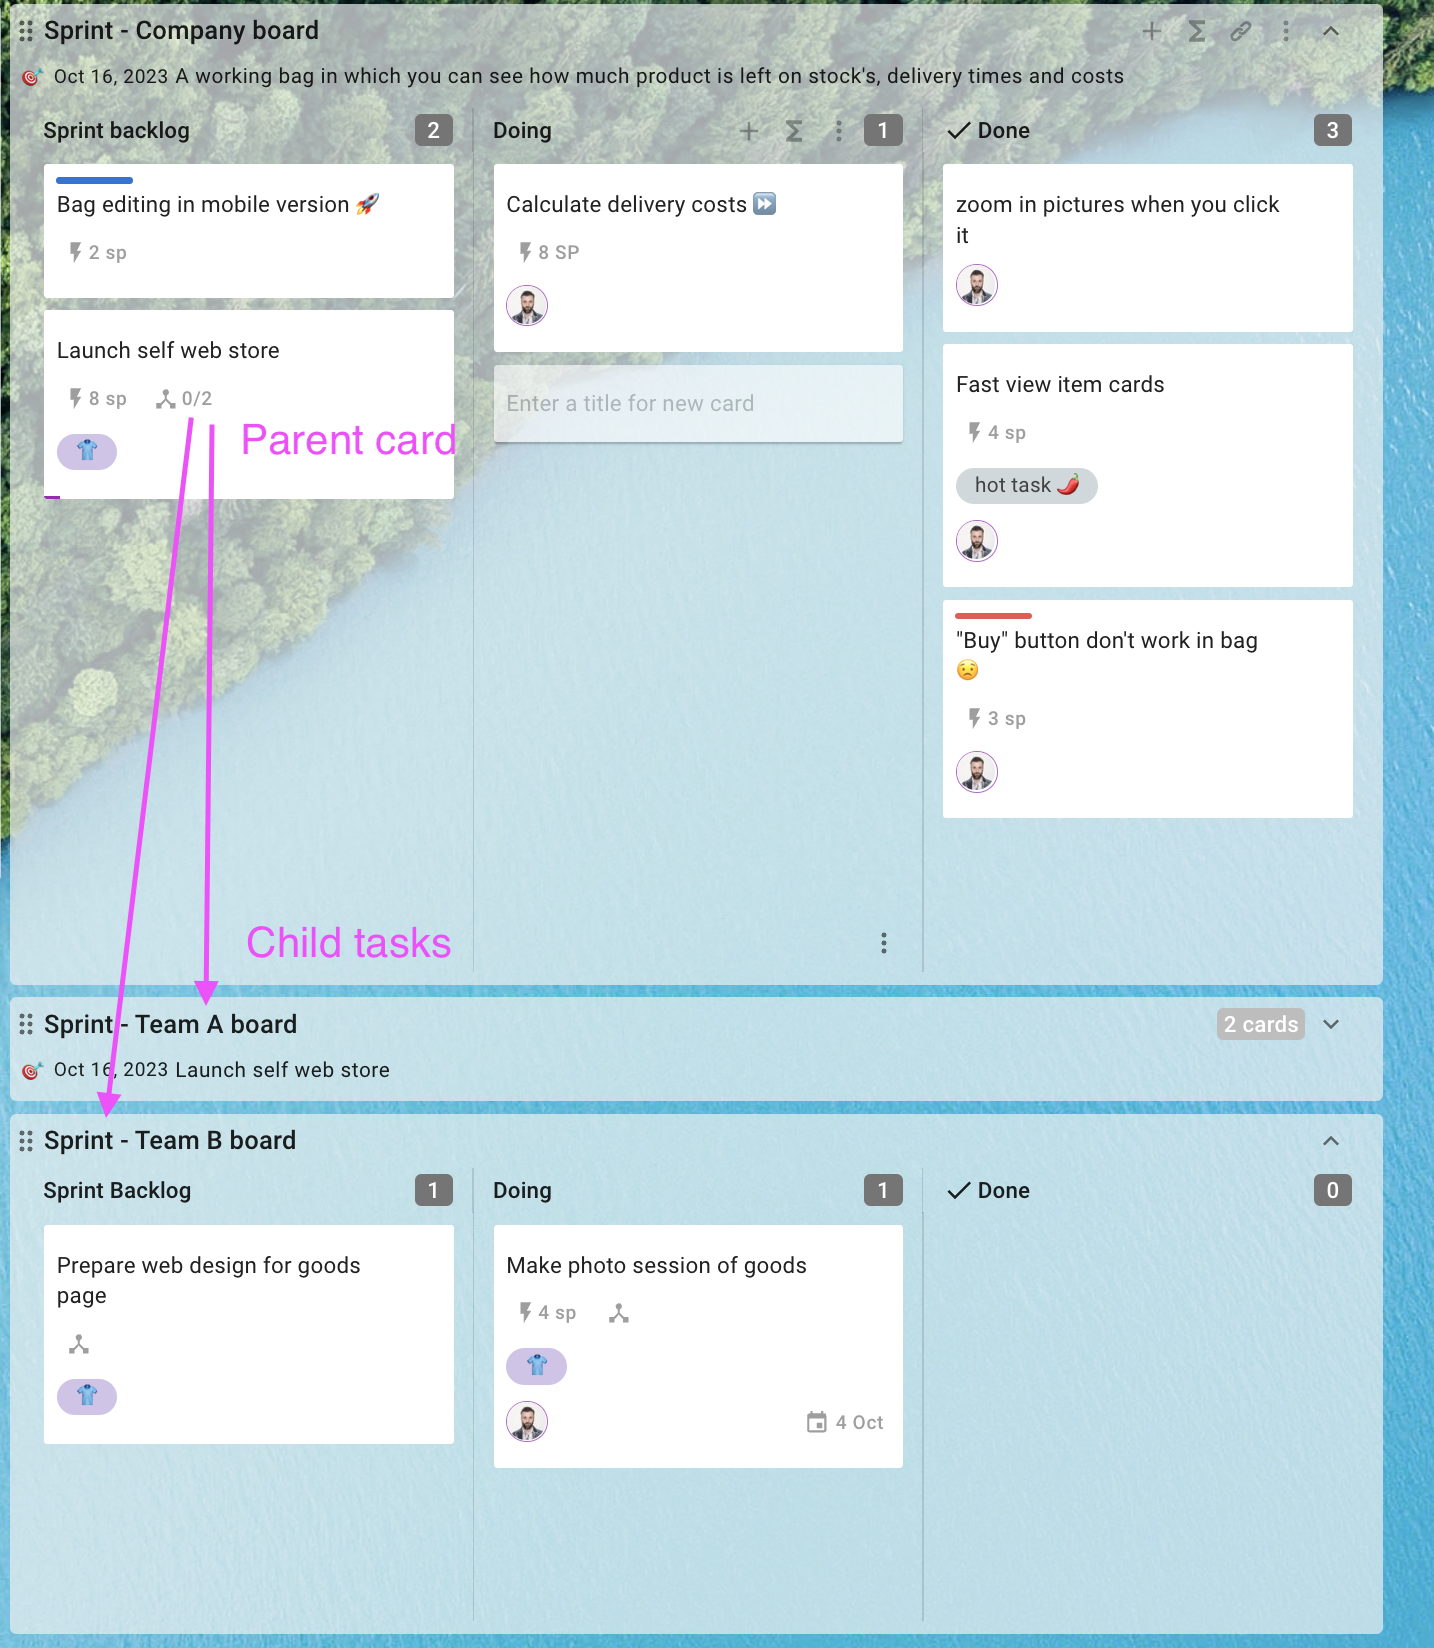
In this case, the sprint report will also be two-level: separately for large tasks and for child cards
on team boards.
Try all the features of FlowFast for Scrum Teams in the trial space.
In the window that appears, select the “Scrum” template.
This is what the newly created board will look like.
You can create additional tracks and columns on boards in FlowFast. This will help, for example,
organize the backlog.
To add a track, you need to click on the + next to the board name and select “Add lane”.
We create three tracks in the backlog: urgently, next sprint and someday.
You can create an unlimited number of tracks on the board, for example, to plan work several
sprints ahead.
So that the track does not take up much space on the board, it can be rolled up.
Five-track backlog for planning several sprints ahead
Scrum boards in FlowFast have a sprint launch feature. When launched, a mark on the sprint
dates will appear on the board, and sprint analytics will become available to you: a burndown
chart and team speed.
To start a sprint, click on the three dots in the upper right corner of the Sprint board. From the
board drop-down menu, click “Start Sprint”.
Next in the form you need to fill in the name, start and end date of the sprint. Optionally, you can
set its purpose.
After the launch, a mark will appear on the board indicating that the sprint has started. By clicking
on this mark, the team can view the combustion graph in real time.
Marking the end date of the sprint on the board
When the sprint is completed and the status of the cards is updated (they are in the columns
corresponding to their status), click on the name of the sprint and “Complete” in the window that
appears
After the sprint is completed, all cards in the “Done” column will be archived. Unfinished tasks will
remain on the sprint board.
To start a new sprint, drag cards from the Backlog board to the Sprint board in the Sprint Backlog
column. If there are unfinished items on the board from the last sprint, also move them to the
“Sprint Backlog” column and start a new sprint.
For simple rating options, such as Story Points, you can use the Size field.
Open the card, click on the purple button in the upper left corner. Select the "Size" field.
Adding a Size field to a card
After this, the “Size” field will appear on the card. Click on “Set size” and enter the estimated size
of the task in any units.
The task size will be visible on the card front in the lower left corner.
Each card in the sprint backlog shows its size
For poker planning, you can use the “Collective Assessment” field, which allows you to conduct
poker planning meetings in hidden assessment mode.
A burndown graph shows how much work has already been done and how much remains to be
done. The team can view their combustion graph at any time.
How to view a sprint burndown chart
This is what the burndown chart looks like for a completed sprint.
The burndown chart displays information about added and removed tasks from the sprint.
Below the burndown chart, the report contains information about the status of the task at the end
of the sprint.
All graphs and reports are saved in the “Reports” section, i.e. At the retrospective, you will be able
to view a report from any past sprint.
The left column in the graph shows the assessment of tasks taken into the sprint (the sum of the
assessments of cards in the columns of the “Queue” and “In Work” types at the time the “Start
Sprint” button was clicked).
The right column displays the sum of the grades of completed cards (those in the "Done" column)
at the end of the sprint.
This graph shows the contribution of each participant to completing tasks during the sprint.
The values are calculated as follows: for each card completed in the sprint, its size is divided by
the number of participants, then these numbers are summed for each participant.
As Scrum scales, the number of Scrum Teams increases and it becomes increasingly difficult to
synchronize their work. FlowFast solves this problem by using two-tier boards. You can create a
top-level Scrum board with large tasks and team boards on which child tasks in relation to the
sprint tasks will live.
In this case, the sprint report will also be two-level: separately for large tasks and for child cards
on team boards.
Try all the features of FlowFast for Scrum Teams in the trial space.


